In today’s fast-paced digital landscape, achieving perfect observability isn’t just desirable—it’s essential. Enter Grafana, the visualization powerhouse that has revolutionized how Site Reliability Engineers (SREs) monitor and maintain systems. This guide will take you from Grafana beginner to seasoned expert, unlocking insights and strategies that ensure your team stays ahead of downtime, performance issues, and everything in between.
Section 1: Welcome to Grafana—Your Observability Companion
1.1 The Power of Grafana
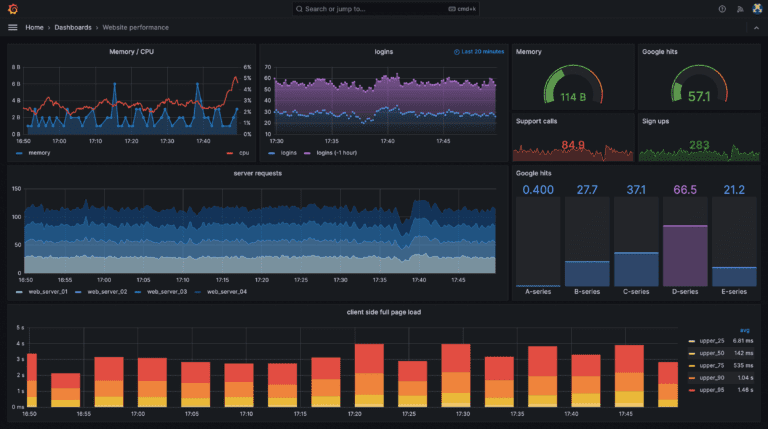
Imagine having a crystal-clear window into your entire system’s health, performance, and behaviors. Grafana does exactly that, empowering SREs with stunning visualizations and deep analytical capabilities.
1.2 Getting Started: Quick & Easy Installation
- Docker: Set up Grafana in seconds with Docker’s seamless containerization.
docker run -d --name=grafana -p 3000:3000 grafana/grafana- Kubernetes via Helm: Scale effortlessly with Kubernetes.
helm repo add grafana https://grafana.github.io/helm-charts
helm install grafana grafana/grafana --namespace monitoring
1.3 First Steps: Your Gateway to Grafana
Access your vibrant new Grafana dashboard instantly at http://localhost:3000, with intuitive default credentials (admin/admin) to get you started.
Section 2: Unlocking the Potential of Your Data
Seamlessly integrate Grafana with powerful data sources for full-stack visibility:
| Data Source | Why You’ll Love It | How to Set It Up |
|---|---|---|
| Prometheus | Real-time metrics for proactive insights | Simple URL-based setup |
| Loki | Effortless log management | Deploy Promtail and you’re all set! |
| Elasticsearch | Advanced analytics for deep log diving | Configure indices and secure easily |
| Jaeger/Tempo | Unparalleled tracing for microservices | Deploy agents seamlessly |
| CloudWatch | AWS insights, simplified | Quick IAM configuration |
Section 3: Crafting Dashboards That Inspire Confidence
3.1 Visual Storytelling at Its Finest
Great dashboards tell stories—highlighting trends, pinpointing issues, and driving decisions. Grafana’s dashboards bring your data to life through engaging visuals.
3.2 Examples You’ll Love (PromQL)
- CPU Monitoring:
100 - avg(rate(node_cpu_seconds_total{mode="idle"}[5m])) * 100- Memory Insights:
node_memory_MemAvailable_bytes / node_memory_MemTotal_bytes * 100- Disk Health:
(node_filesystem_size_bytes - node_filesystem_free_bytes) / node_filesystem_size_bytes * 100Section 4: Alerting Made Easy
Never miss critical issues with Grafana’s sophisticated alerting system:
- Quick Alert Setup (High CPU):
expr: avg(rate(node_cpu_seconds_total{mode!="idle"}[5m])) by(instance) * 100 > 85
for: 5m
labels:
  severity: critical
annotations:
  summary: "CPU Utilization Critical!"
Integrate seamlessly with Slack, PagerDuty, and email for swift action.
Section 5: AIOps Magic—Automation Meets Intelligence
Supercharge Grafana with advanced AI-driven anomaly detection:
- Memory Anomaly Detection:
abs(rate(node_memory_MemAvailable_bytes[1h]) - node_memory_MemAvailable_bytes) > 0.2 * avg_over_time(node_memory_MemAvailable_bytes[1h])Automate responses and keep your team agile using tools like Robusto and PagerDuty.
Section 6: Performance Optimization for Maximum Efficiency
6.1 Snappy Dashboards, Happy Teams
Boost performance through query simplification and Grafana caching.
6.2 Scale with Confidence
Scale horizontally and enhance reliability with Grafana clustering and external databases.
Section 7: Smooth Sailing with Quick Troubleshooting
Quickly overcome common Grafana hurdles:
| Issue | How to Solve It |
|---|---|
| Slow Dashboards | Simplify queries and enable cache |
| Alert Issues | Double-check SMTP/webhook configs |
| Data Source Connectivity | Verify settings, credentials, and firewall |
Section 8: Security Without Compromise
Protect your data with:
- HTTPS encryption
- Robust OAuth/LDAP authentication
- Comprehensive audit logging
Section 9: Real Success Stories—Reducing MTTR
Learn from teams who drastically reduced MTTR by 60% using Grafana’s powerful visualizations and alerts.
Section 10: Timeless Best Practices
Ensure enduring success:
- Regular updates and patching
- Clear, actionable dashboards
- Regular training sessions
- Reliable backups
Section 11: Level-Up Your Grafana Expertise
Dive deeper with:
- GitOps dashboard provisioning
- Version control for dashboards
- Stunning customizations
- Grafana Cloud’s unlimited scalability
Section 12: Your Community Awaits
Join Grafana’s vibrant community on forums, contribute plugins, or track developments via GitHub.
Section 13: Taking Your Next Steps with Confidence
Your observability journey is just beginning. Audit, refine, and grow your Grafana strategy continually to maintain peak operational excellence.
With Grafana, observability transforms from a challenge into your greatest competitive advantage.


