Tracing an AI request through Cloudflare and its origin
Follow a slow AI request from Cloudflare to an instrumented origin, configure sampling, and verify that the trace preserves the evidence needed to investigate.
Understand what your systems are telling you, and what they are not.
Follow a slow AI request from Cloudflare to an instrumented origin, configure sampling, and verify that the trace preserves the evidence needed to investigate.
API Gateway now supports API keys for MCP tools/list. Discovery and execution keep separate authentication rules, and the MCP feature remains in Preview.
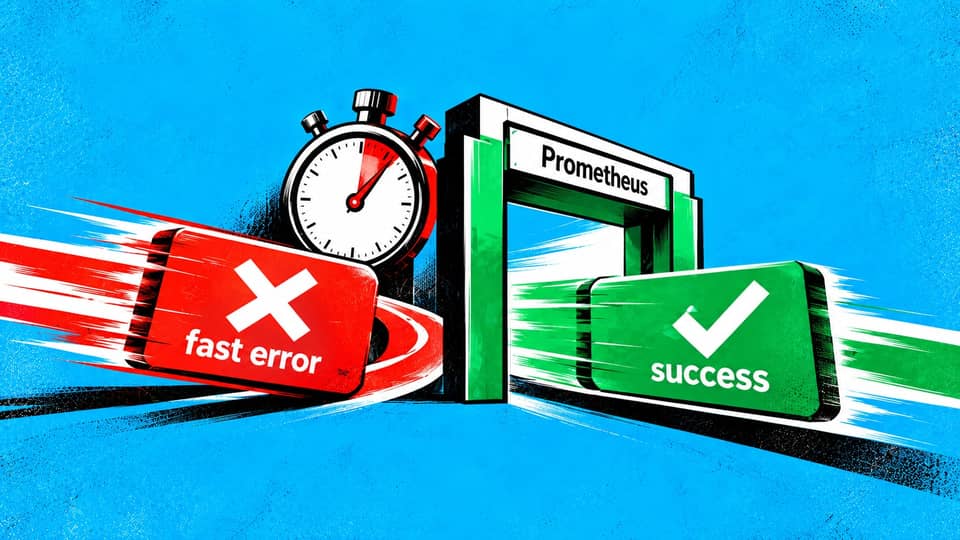
Build a latency SLI from Prometheus histogram buckets, include failed requests, and compare classic and native queries with a worked search-service example.
A fresh incident summary and a historical export can share a queue without sharing a retry lifetime. The handler still checks expiry and earlier results.
Apigee separates model latency and token use from MCP tool traffic. Tool filters narrow a slow-assistant investigation, while proxy policies determine which charts populate.
A synthetic order-service incident follows a shared handoff through page edits, new findings and shift change, including the review and access work involved.
The streaming preview can reveal model output sooner. A new gateway and whole-request deadlines determine whether the reader also receives the ending.
Tail sampling selects recorded traces by error, latency and other evidence. A checkout timeout shows how routing, waiting time and memory affect the trace a responder can retrieve.
Google’s legacy agents have left standard maintenance. During replacement, a small change to a disk’s name can leave a healthy-looking system with an empty alert.
A persistent queue can save telemetry through an outage. Check delivery, catch-up capacity and event age before letting the recovered data drive an action.
Keep zero errors, no traffic and missing measurements distinct in Prometheus before a dashboard or release gate turns a gap into reassurance.
How Kubernetes metadata connects telemetry to workloads, and how to test the queries and paging routes that depend on it during a v1 migration.