

On this page5 sections
To measure a streaming LLM service, time the first answer text and the completed response at the client, then report those timings alongside completed, rejected and interrupted requests under the same offered workload. Server token throughput helps explain capacity, but it cannot tell you how many callers received the answer they needed.
Consider a hypothetical incident assistant that summarizes a sanitized bundle of logs. Engineers can start reading while the answer arrives, so an early first sentence is useful. They still need the complete summary before judging its explanation. A serving change that produces the opening sooner but abandons more summaries has improved one part of the experience while making another worse. Measuring both makes that tradeoff visible.
The practical question is how to collect those observations without turning every byte on the wire into a token, every closed connection into a success, or a quieter benchmark into a faster service. A small client probe establishes what arrives. A controlled workload comparison then shows whether the change is worth keeping.
The first output and the finished answer have different clocks
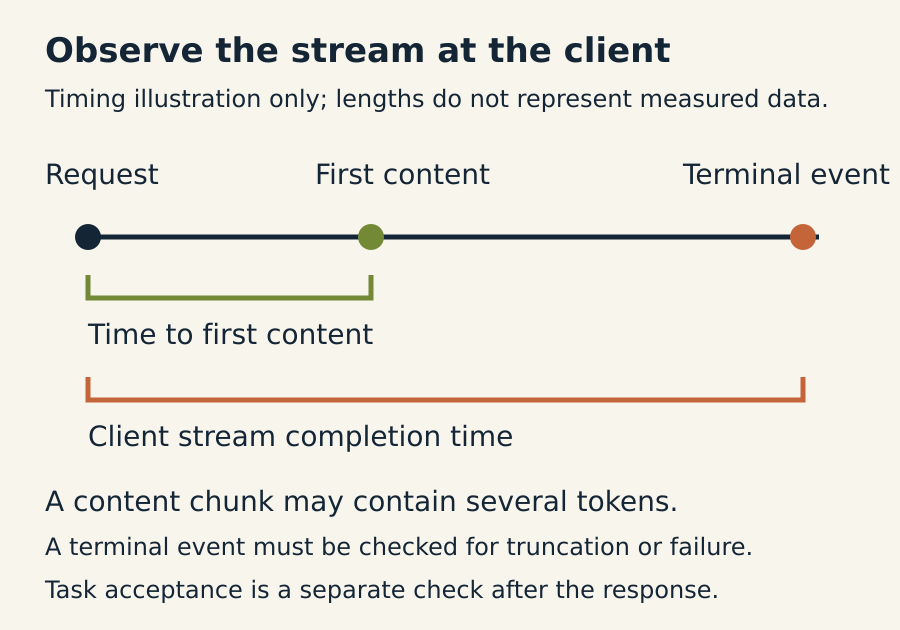
Time to first token, or TTFT, describes the delay before generation begins producing output. Its meaning depends on where the clock starts and where output is observed. An engine measurement and a client measurement cover different paths. The client also encounters connection setup, proxies and delivery, which can matter even when the model's own timing improves.
For a text interface, the first response headers or an event announcing the assistant's role are too early to establish that there is something to read. Start a separate client timer at request submission and stop it when nonempty answer text arrives. Call that measurement time to first text. A model that streams reasoning separately may produce reasoning tokens before its answer, so this number need not equal the provider's TTFT. It also stops before the interface renders the text; display latency requires instrumentation in the actual application.
Completion latency runs until the response reaches the terminal condition the consumer expects. For our log summary, that means the answer finishes normally and its stream terminates as expected. Reaching an output-token cap is a different outcome: text arrived, but the summary may have been cut off. If the consumer expects a structured object, its parser and required-field checks become part of determining whether the requested work is complete.
Between the two endpoints, output can arrive unevenly. Server-Sent Events, or SSE, carries events over an HTTP response. An event can contain several tokens; it can also contain metadata or an error. Timing the gap between text-bearing events therefore measures delivery cadence, not necessarily the time between individual model tokens.
The distinction appears explicitly in vLLM's metrics design: its inter-token latency metric records gaps between streamed output events, while its request-level time-per-output-token measurement divides the interval after TTFT by output tokens minus one. These measurements can differ when an event bundles tokens or when aggregation weights requests differently. Preserve their names and populations instead of making them interchangeable dashboard labels.
A client probe you can inspect
The following Python standard-library example sends one synthetic request to an OpenAI-compatible chat endpoint. It ignores role-only events, records the first nonempty answer text, and requires a normal stop finish plus the [DONE] marker to count completion. HTTP 429 and 503 responses are classified as rejections; malformed or interrupted streams remain unsuccessful.
It is a diagnostic probe, not a concurrent load generator or a model-quality test. Its protocol handling was checked against a local synthetic SSE fixture. No model-serving performance test or production result is claimed. An endpoint using different termination semantics needs a deliberately adapted check rather than a more permissive definition of success.
import http.client
import json
import os
import socket
import sys
import time
import urllib.error
import urllib.request


def events(response):
    data = []
    for raw in response:
        line = raw.decode("utf-8").rstrip("\r\n")
        if line == "":
            if data:
                yield "\n".join(data)
                data = []
        elif line.startswith("data:"):
            data.append(line[5:].lstrip(" "))


def probe(url, model):
    payload = {
        "model": model, "stream": True, "temperature": 0,
        "max_tokens": 128,
        "messages": [{"role": "user", "content":
            "Explain what a Kubernetes readiness probe checks in three sentences."}],
    }
    headers = {"Content-Type": "application/json", "Accept": "text/event-stream"}
    if os.environ.get("LLM_API_KEY"):
        headers["Authorization"] = "Bearer " + os.environ["LLM_API_KEY"]
    request = urllib.request.Request(url, json.dumps(payload).encode(), headers)
    started = time.perf_counter()
    first = finished = None
    reason = None
    text_events = chars = 0
    outcome = "interrupted"
    try:
        with urllib.request.urlopen(request, timeout=30) as response:
            if "text/event-stream" not in response.headers.get("Content-Type", ""):
                raise ValueError("expected SSE")
            for event in events(response):
                now = time.perf_counter()
                if event == "[DONE]":
                    outcome = "completed" if reason == "stop" and first is not None else "noneligible_finish"
                    if outcome == "completed":
                        finished = now
                    break
                item = json.loads(event)
                if "error" in item:
                    outcome = "api_error"
                    break
                for choice in item.get("choices", []):
                    if choice.get("index", 0) != 0:
                        continue
                    content = choice.get("delta", {}).get("content")
                    if isinstance(content, str) and content:
                        first = now if first is None else first
                        text_events += 1
                        chars += len(content)
                    if choice.get("finish_reason") is not None:
                        reason = choice["finish_reason"]
    except urllib.error.HTTPError as error:
        outcome = "rejected" if error.code in (429, 503) else "http_error"
    except (TimeoutError, socket.timeout):
        outcome = "timeout"
    except (urllib.error.URLError, http.client.HTTPException,
            OSError, ValueError, TypeError, AttributeError):
        outcome = "client_or_protocol_error"
    return {
        "outcome": outcome, "finish_reason": reason,
        "first_text_seconds": None if first is None else first - started,
        "completion_seconds": finished - started if outcome == "completed" else None,
        "observation_seconds": time.perf_counter() - started,
        "text_events": text_events, "output_characters": chars,
    }


if __name__ == "__main__":
    print(json.dumps(probe(sys.argv[1], sys.argv[2]), sort_keys=True))
Save it as stream_probe.py and use the model identifier reported by your server. For example, with an already running local endpoint:
python stream_probe.py http://127.0.0.1:8000/v1/chat/completions YOUR_MODEL_IDSet LLM_API_KEY in the process environment if the endpoint requires one; the script does not print it or retain the answer text. The llama.cpp server reference documents its streaming chat endpoint and model identifiers. A typical local llama.cpp endpoint uses port 8080, but use the actual configured port and a supported chat template.
The output separates first_text_seconds from completion_seconds and preserves the outcome. A missing first-text value means no answer text reached this client. A missing completion value means the probe did not observe the required normal finish, even if some text appeared. text_events counts delivery events and output_characters counts characters; neither is a token count.
The 30-second socket timeout limits blocking network operations, not the total request lifetime, as the Python URL-opening documentation explains. A stream that keeps sending data can outlive it. Use the application's real overall deadline in the later load test, and retain its timeout outcomes. Changing deadlines between trials would change which work is allowed to finish.
Keep arrivals fixed while testing the change
Suppose the serving hypothesis is that a scheduling change reduces waiting before generation. Repeat the same sanitized prompt set with the same model, quantization, sampling settings, requested output limits and arrival schedule. Record actual input and output lengths when available because the output cap alone does not ensure identical generated work. Separate short log summaries from larger evidence bundles so one class cannot conceal another's slower response.
The arrival schedule matters as much as concurrency. A client that waits for one request to finish before sending its replacement offers less work when responses become slower. That is useful for simulating a fixed group of interactive users, but a before-and-after result from it does not establish performance under a fixed arrival rate.
vLLM's serving benchmark reference distinguishes request rate from its maximum-concurrency cap. The cap can make actual arrivals lower than the requested rate when requests take longer. Save both the intended schedule and observed submissions. If the generator falls behind, the comparison has a client-side limitation to resolve before attributing the apparent improvement to serving.
Keep warmup and cache conditions explicit too. A repeated prompt set can become a favorable cached workload. That may fit an assistant repeatedly reading the same runbook prefix, but it answers a different capacity question from fresh incident evidence. Compare like cache conditions, or present cached and uncached trials separately. Change one serving variable at a time so the result can test the stated hypothesis.
The approved principle behind the Linux tuning guide applies here: evaluate latency, completed work and rejected work together under comparable offered demand. The streaming-specific addition is deciding which output starts the clock and which terminal event establishes that an answer actually arrived.
A faster opening can coexist with fewer answers
Here is an illustrative accounting exercise, not benchmark data. Two configurations receive the same 100 requests with the same prompt mix, arrival schedule and deadlines. The table counts every offered request once after the same observation procedure.
| Outcome | Configuration A | Configuration B |
|---|---|---|
| Offered requests | 100 | 100 |
| Normally completed responses | 80 | 60 |
| Rejected before an answer | 10 | 30 |
| Interrupted or timed out | 10 | 10 |
| Completed responses satisfying timing and application checks | 72 | 54 |
| Median first-text time among normal completions | 0.9 seconds | 0.4 seconds |
Configuration B starts the surviving answers sooner, but delivers fewer normally completed answers and fewer answers satisfying the chosen checks. Its useful-completion fraction is 54%, compared with 72% for A. The first-text median describes a selected population; requests that never produce a completed answer are outside that number. Reporting it alone would hide the work refused or lost.
Useful completion needs an application-specific check. For the hypothetical assistant, a complete response should address the supplied evidence and retain its stated uncertainty. The probe's normal terminal marker proves delivery behavior, not that those claims are correct. Timing-based goodput similarly counts completed requests meeting specified latency constraints; it does not establish factual accuracy unless a separate quality evaluation supplies that evidence.
A protective rejection policy can still be appropriate when accepting more work would overwhelm a dependency or leave every caller waiting indefinitely. That changes the recommendation: compare the policy with the overloaded baseline, include refused work and any later retry or deferral, and judge whether the accepted population meets its objective. Describe the benefit as bounded protection rather than an unconditional speed gain. Retries are additional offered work and belong in the accounting.
Use server metrics to explain the client result
Once client outcomes agree with the intended definition, server telemetry helps locate the delay. The vLLM production metrics list TTFT and end-to-end latency histograms, queue-time measurements and waiting-request gauges. Pair their changes with the client observations to investigate whether waiting, generation or delivery accounts for the regression. Match the exact installed version and exposed metric names before writing queries.
llama.cpp exposes a different set of metrics, including generated-token counters and generation-throughput gauges, when its metrics endpoint is enabled. These describe engine activity; they do not replace a client count of completed answers. Adding throughput across a server fleet can show more generated tokens while particular callers still lose their responses.
For histogram dashboards, Prometheus documents why distributions can be aggregated across replicas but replica percentiles cannot simply be averaged. Its query-function reference also requires calculating each counter's rate before aggregation so resets remain detectable. Our latency-SLO histogram guide develops that query work in detail; this comparison should first settle which requests and completion conditions those queries represent.
For the log-summary assistant, keep a serving change when its client timings improve at the tested demand without an unacceptable loss of useful completed summaries or a regression hidden in larger requests. Retain the prompt mix, arrivals, deadlines and outcome counts with that decision. The next engineer can then repeat the comparison when the model or workload changes and tell whether the earlier first sentence still leads to an answer worth waiting for.
Source context
Source links appear within this article. Read them alongside the author’s analysis and evaluate the guidance against your environment.
Report an error or outdated detail