

On this page5 sections
The request reached Cloudflare quickly. The answer still took too long. Between those two facts, an incident assistant may have crossed a Worker, searched an origin’s runbooks and waited for a model. A single duration puts a number on the delay. A trace becomes useful when it follows enough of that journey to show which part deserves the next question.
Cloudflare Traces records real request processing through supported platform operations. It can connect that view to instrumented application spans, but forwarding a trace identifier does not create the missing application measurements. This guide follows one hypothetical slow runbook search from the edge to its origin, showing how to enable the relevant tracing, retrieve a controlled request and recognize what the resulting picture still leaves unknown.
Choose a request with a question worth answering
Consider a hypothetical incident assistant whose /ask endpoint calls an origin service. That service retrieves a runbook before requesting a model response. Engineers want to distinguish time spent reaching the origin from retrieval and inference inside it. The example is an evaluation design, not a Cloudflare deployment or a measured performance result.
Start with that blocked investigation and verify the request can be found under the intended sampling policy. An impressive waterfall that stops at the origin cannot answer whether retrieval or inference was slow. Our first-path tracing guide develops this principle: instrument the boundaries needed to answer the question, then retrieve the evidence before expanding coverage.
A span records one operation’s timing and related information. Parent and child spans connect that operation to the work around it. Cloudflare’s overview describes a hierarchy of supported platform spans and lookup by Ray ID, the identifier associated with the Cloudflare request. Its separate Cloudflare Trace configuration simulator predicts rule behavior; it is not a record of the request that actually ran.
Enable the two parts of the view
Enable domain tracing for the domain receiving the test request. In the domain configuration, persistence makes traces available in Cloudflare’s dashboard; export sends them to a configured OpenTelemetry destination. For our investigation, select a destination where the application’s own spans can also be inspected.
The Worker has a separate tracing configuration. Cloudflare’s Workers tracing reference documents automatic handler, fetch, binding and RPC instrumentation. Merge the following fragment into the test Worker’s existing Wrangler configuration; it is not a complete deployable application:
{
  "observability": {
    "traces": {
      "enabled": true,
      "head_sampling_rate": 0.05
    }
  }
}
The Worker sampling value is a fraction: 0.05 means five percent. Domain configuration expresses its sample rate as a percentage. These are separate controls, so copying a number between them changes its meaning. Five percent here is an illustrative traffic allowance, not a recommended production rate. Workers tracing defaults to tracing every invocation when enabled without an explicit rate.
Before enabling collection beyond the test, inspect the attributes the chosen operations record. Keep prompts, credentials and confidential runbook contents out of custom attributes. Review the account’s actual ingestion, export and retention arrangements, including the external destination; this guide does not assume that domain traces and Workers events share one price or retention window.
Connect the origin instead of assuming it is visible
In the domain settings, forwarding W3C trace context to the origin lets an instrumented origin connect its spans to the request. Context contains the identifiers used to relate the work, not the work’s timing measurements. The origin still needs instrumentation for the retrieval and inference operations. Send those application spans and the Cloudflare spans to the same OpenTelemetry destination to inspect the joined view.
Incoming context is a different setting. Cloudflare’s documentation says its default is Reject and warns that accepted context is not verified as coming from a trusted caller. A trace identifier is useful for joining records, rather like a reference written on related pieces of paperwork. It does not prove who supplied the paperwork. Keep acceptance aligned with the application’s trust model instead of treating a shared identifier as authentication.
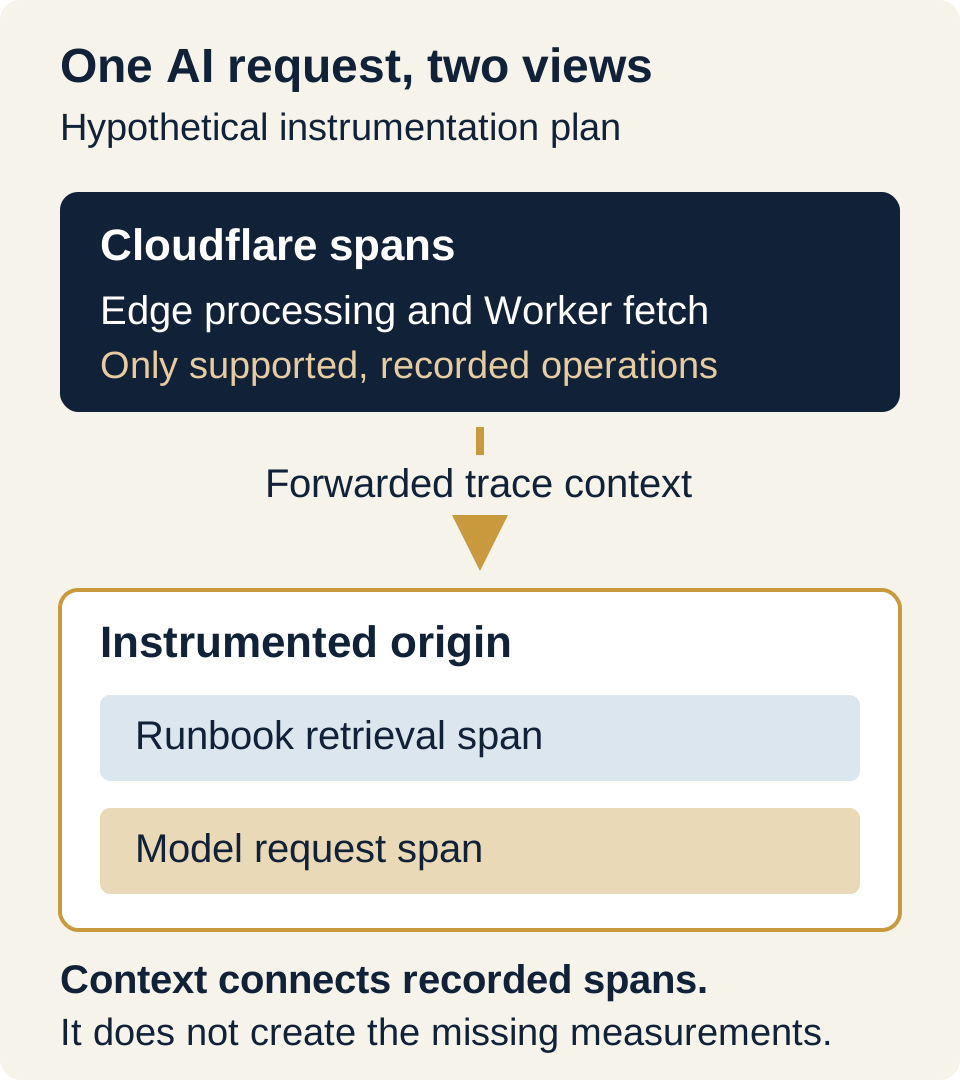
Open the joined record for the slow runbook search and look for the work you expected: retrieval first, then inference. If the only bar is the fetch to the origin, you have found where the waiting happened from Cloudflare’s point of view, but not what happened inside. Instrument those application operations before tuning either component. Otherwise the longest bar is likely to become a confident name for something it never measured.
Find a known request under controlled sampling
Use a synthetic request in an authorized test environment and record its request identifier, time and expected operations. A low head-sampling rate can omit that request entirely. Head sampling makes its selection before the final outcome is known, so an omitted request cannot later supply a trace merely because it turned out to be slow.
For a bounded reproduction, choose a domain trace rule matching only the test path and set its sample rate to 100 percent while the experiment runs. Cloudflare uses the first matching rule, so inspect the rule order. Keep the Worker and application sampling settings explicit too; a domain rule is not proof that every downstream span was retained. Restrict the route and test input, then restore the agreed sampling configuration afterward.
Introduce a known delay in the test origin’s retrieval operation. Retrieve the request by its Ray ID, inspect the platform hierarchy, and find the application’s corresponding retrieval span at the shared destination. The question is whether the known delay remains visible at the boundary meant to explain it. Record any missing spans, failed export or broken parent relationship separately from a short observed duration.
Read the span’s definition before naming the bottleneck
Cloudflare’s span reference explains why a long platform span is not automatically an application diagnosis. The dynamic span includes connection setup, sending the request, waiting and transferring the complete response. The response span includes delivery to the client. A streaming AI answer can therefore occupy these intervals well after its first output arrives.
In the hypothetical test, a long origin-facing interval and a long retrieval child span support inspecting that retrieval path. A long interval without the child span leaves several explanations open. Read sibling overlap and parent timing instead of adding every bar: a parent includes work represented by its children, and concurrent operations can overlap. Our guide to reading distributed traces explains those timing relationships in more detail.
If retrieval is uninstrumented, the trace cannot establish that inference caused the delay. Keep the unresolved interval visible and obtain the missing application evidence. That changes the next action from tuning the model to repairing the measurement needed to choose between the competing causes.
Finish with one request a teammate can follow from the edge into the deliberately delayed retrieval. Keep its identifier and collection settings so the same person can find it again, then repeat under the sampling policy you intend to operate. The long wait has become a route into the system. That is more useful than a beautiful waterfall whose most important interval still has no explanation.
Sources & context
Sources linked in this article. Read alongside the author’s analysis; a citation does not independently verify a publisher’s claims.
- Cloudflare Traces overviewdevelopers.cloudflare.com
- Domain tracing configurationdevelopers.cloudflare.com
- Workers tracing referencedevelopers.cloudflare.com
- Cloudflare span referencedevelopers.cloudflare.com
- Configuration simulatordevelopers.cloudflare.com