How to trace a request into its background job
Follow one background job from handoff to completion, then check whether the trace can tell waiting time apart from worker execution.
Understand what your systems are telling you, and what they are not.
Follow one background job from handoff to completion, then check whether the trace can tell waiting time apart from worker execution.
Read overlapping spans on a shared clock, compare like requests, and use the trace to choose what to check next.
A fleet chart can be correct while one customer group waits much longer. Use counts, a log and a trace to locate the next useful question.
Follow job-42’s four-minute queue wait separately from its eighty-millisecond status reply, and keep the missing download check in view.
Twenty failed exports can be 0.2% of the fleet and 20% of one region. Follow the counts to see what each metric can tell you and what remains outside its view.
Three errors at the same time may belong to three different jobs. Stable fields let you follow the right export without collecting its private contents.
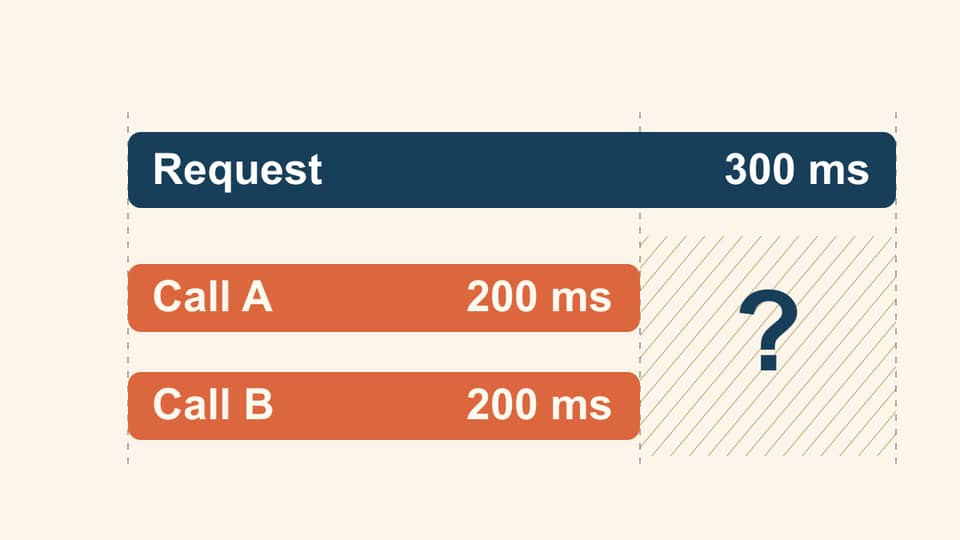
Two lookups overlap, so adding their durations counts some waiting twice. Read the shared timeline to find both the overlap and the time still unexplained.
Start with work you recognize: one synthetic export. Three terminals show its acceptance, background completion and recorded steps without touching a production service.
A background job can succeed while its connection to the request disappears. Break and restore one local handoff to see the difference.
Start with what arrived, what finished and what is still waiting. The machine charts can explain the delay once the customer’s work is visible.
A correct calculation can still end in a quiet inbox. Follow an export alert through its condition, route, message and recovery check.
A job ID helps you find one export. Put it on every metric and it can create a new storage problem. Keep the count and the individual story in useful places.